
Visibility into the metrics that drive SaaS growth
Visibility into the metrics that drive SaaS growth
Visibility into the metrics that drive SaaS growth
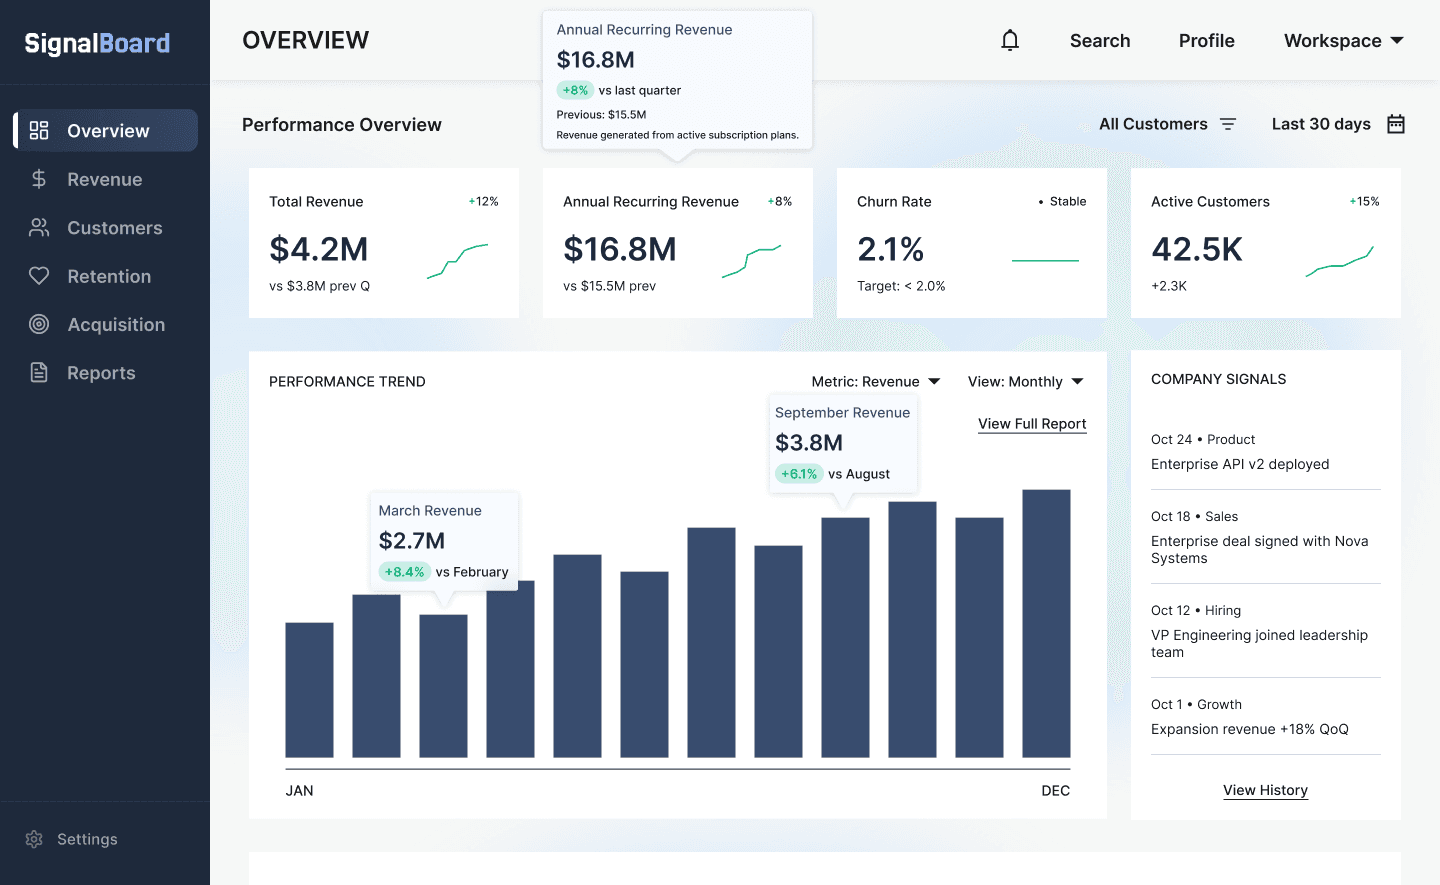
Monitor revenue, churn, acquisition performance, and customer health in a single executive dashboard.
Monitor revenue, churn, acquisition performance, and customer health in a single executive dashboard.
Monitor revenue, churn, acquisition performance, and customer health in a single executive dashboard.
features
features
features
Metrics that tell you
what to do next
Metrics that tell you
what to do next
Metrics that tell you
what to do next
Revenue, retention, and acquisition in one place.
See what's working and what needs attention.
Revenue, retention, and acquisition in one place.
See what's working and what needs attention.

Every metric that matters, one glance
Every metric that matters, one glance
Revenue, churn, and growth in a single view. No switching tabs, no exporting reports.
Revenue, churn, and growth in a single view. No switching tabs, no exporting reports.

Know which cohorts actually stay
Know which cohorts actually stay
Track retention cohort by cohort and see exactly when users start dropping off.
Track retention cohort by cohort and see exactly when users start dropping off.

Spot churn before it costs you
Spot churn before it costs you
See which accounts are slipping, and act while the deal is still salvageable.
See which accounts are slipping, and act while the deal is still salvageable.

See exactly where deals leak
See exactly where deals leak
Follow every stage from visitor to customer and find the drop-off fast.
Follow every stage from visitor to customer and find the drop-off fast.

HOW IT WORKS
HOW IT WORKS
HOW IT WORKS
Understand your SaaS metrics
Understand your SaaS metrics
Understand your SaaS metrics
Connect your data sources, track key metrics, and uncover insights that drive revenue growth.
Connect your data sources, track key metrics, and uncover insights that drive revenue growth.
Connect your data sources, track key metrics, and uncover insights that drive revenue growth.

Connect your data sources
Integrate your CRM, billing, and analytics tools to centralize revenue, acquisition, and customer data.
Connect your data sources
Integrate your CRM, billing, and analytics tools to centralize revenue, acquisition, and customer data.
Connect your data sources
Integrate your CRM, billing, and analytics tools to centralize revenue, acquisition, and customer data.
Track key SaaS metrics
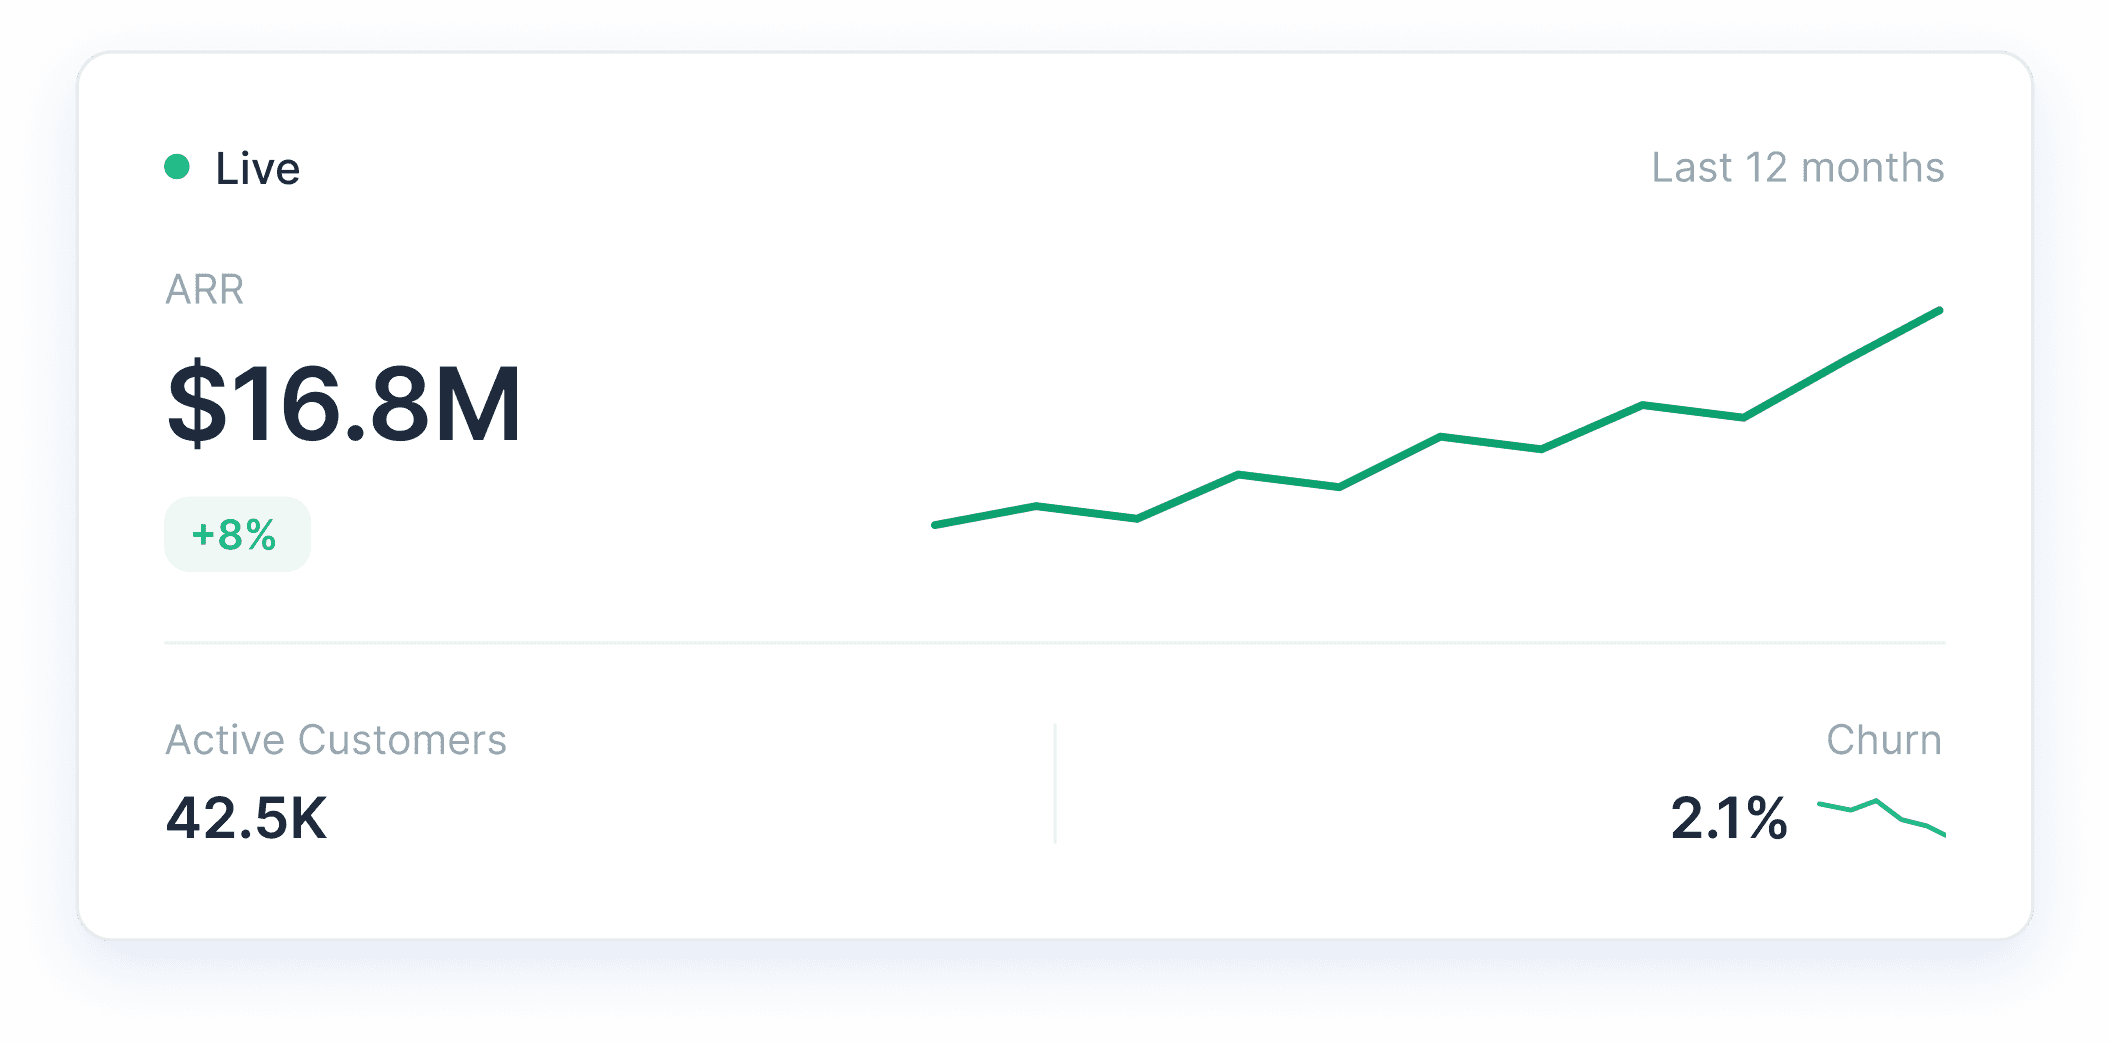
Monitor revenue, customer growth, acquisition performance, and retention in one workspace.
Track key SaaS metrics
Monitor revenue, customer growth, acquisition performance, and retention in one workspace.
Track key SaaS metrics
Monitor revenue, customer growth, acquisition performance, and retention in one workspace.

Turn insights into action
Identify churn risks, evaluate acquisition channels, and make faster decisions with real time analytics.
Turn insights into action
Identify churn risks, evaluate acquisition channels, and make faster decisions with real time analytics.
Turn insights into action
Identify churn risks, evaluate acquisition channels, and make faster decisions with real time analytics.
Insights across the entire customer lifecycle
Insights across the entire customer lifecycle
Insights across the entire customer lifecycle
Understand what drives customer acquisition
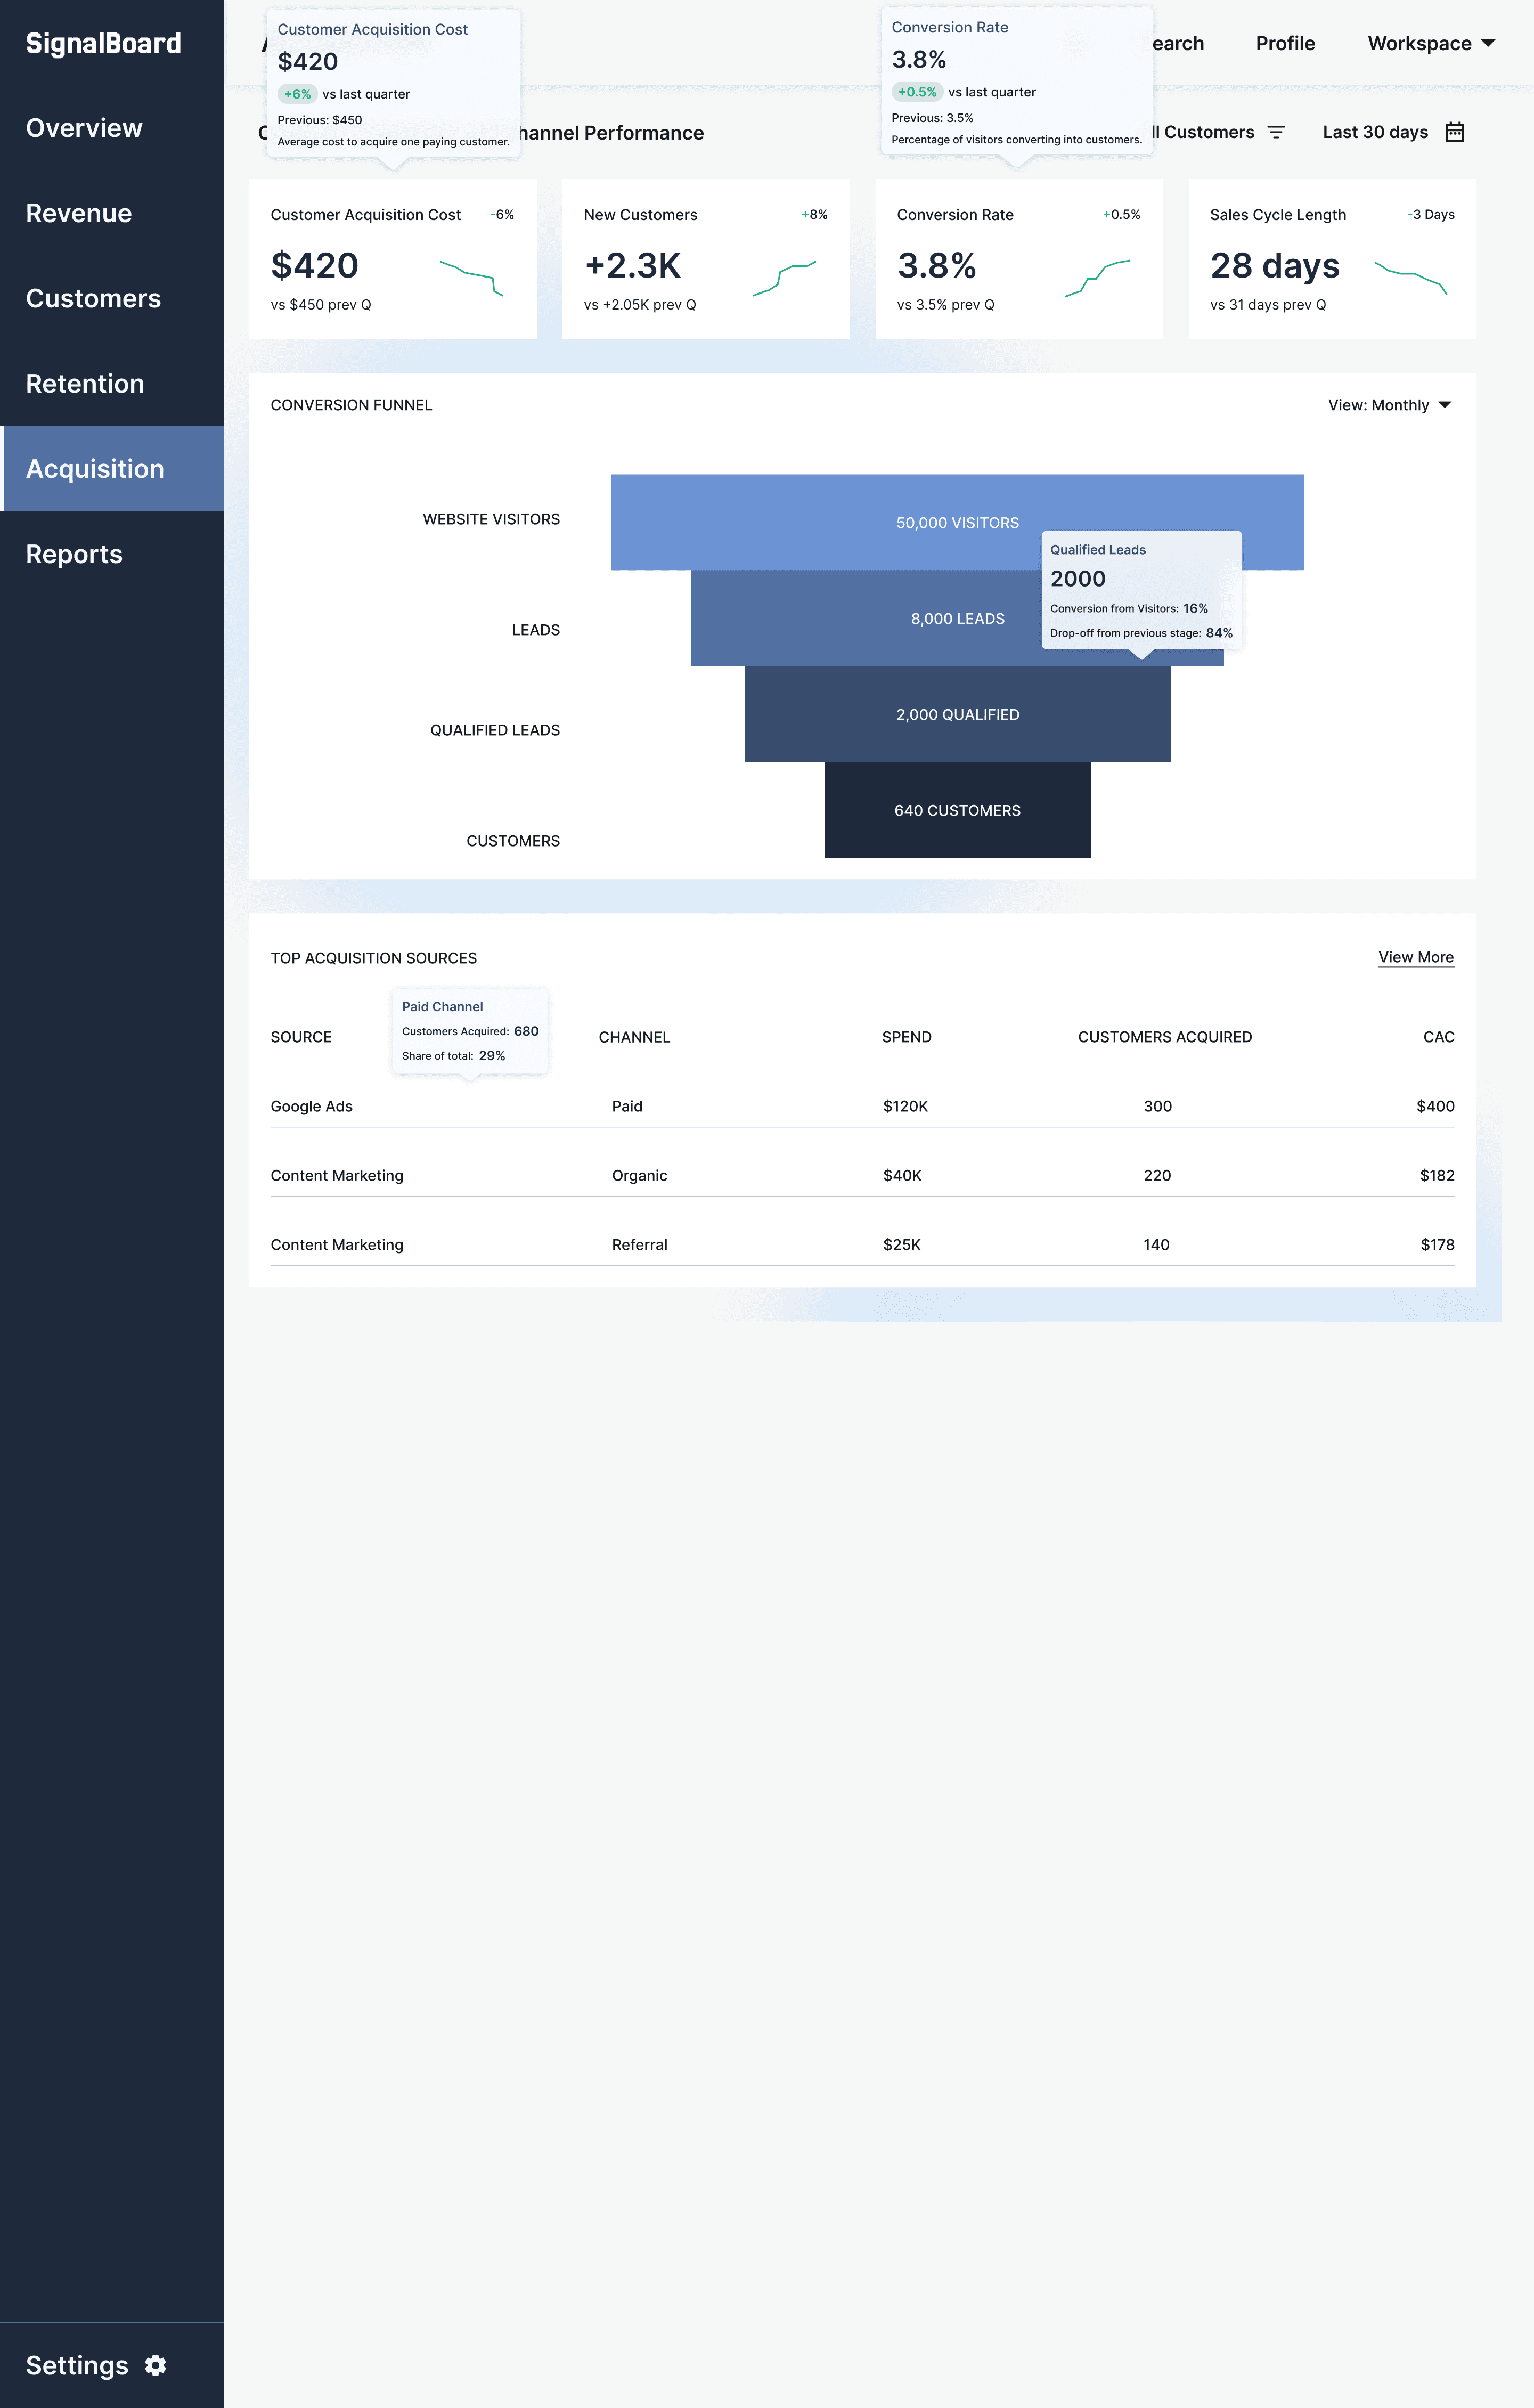
Analyze how visitors move through the funnel, compare channel performance, and track acquisition costs in one place. • Track customer acquisition cost trends • Identify drop-off points in the conversion funnel • Compare performance across acquisition channels

Understand what drives customer acquisition
Analyze how visitors move through the funnel, compare channel performance, and track acquisition costs in one place. • Track customer acquisition cost trends • Identify drop-off points in the conversion funnel • Compare performance across acquisition channels
Understand what drives customer acquisition
Analyze how visitors move through the funnel, compare channel performance, and track acquisition costs in one place. • Track customer acquisition cost trends • Identify drop-off points in the conversion funnel • Compare performance across acquisition channels
Understand customer growth and segmentation
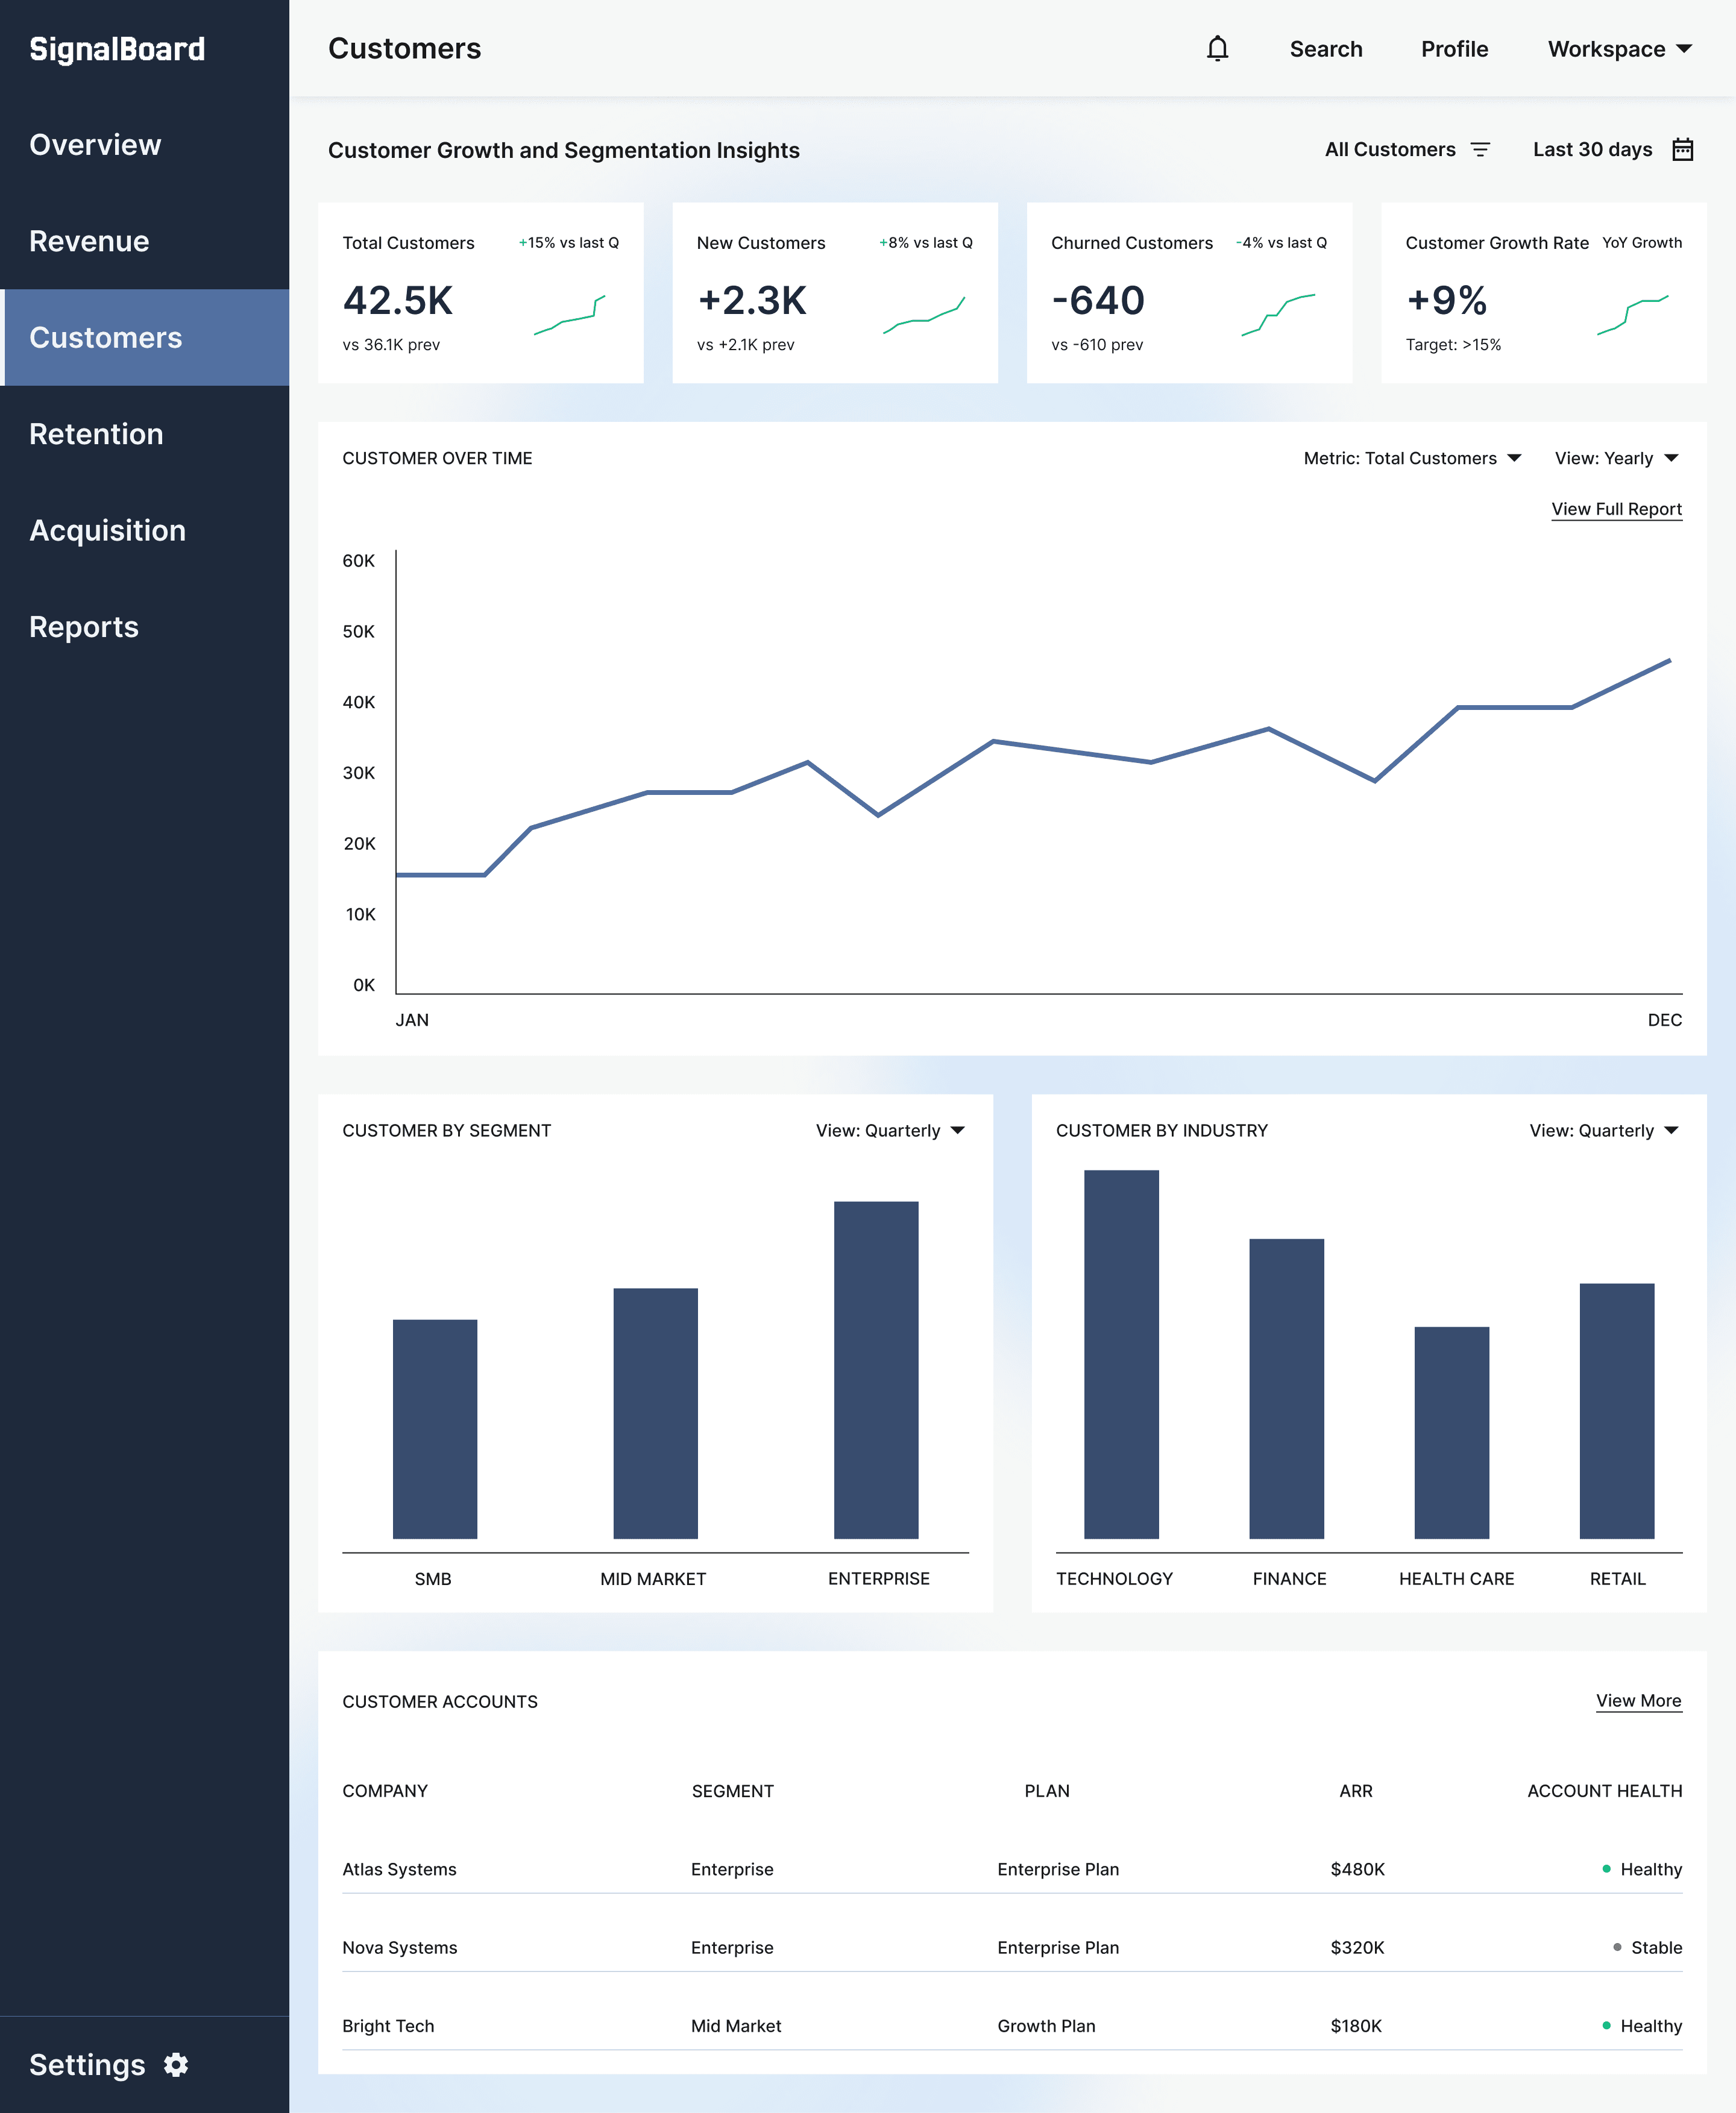
Monitor customer growth, segmentation, and account health to understand where revenue is coming from. • Track customer growth over time • Analyze customer segments and industries • Monitor account health and activity

Understand customer growth and segmentation
Monitor customer growth, segmentation, and account health to understand where revenue is coming from. • Track customer growth over time • Analyze customer segments and industries • Monitor account health and activity
Understand customer growth and segmentation
Monitor customer growth, segmentation, and account health to understand where revenue is coming from. • Track customer growth over time • Analyze customer segments and industries • Monitor account health and activity
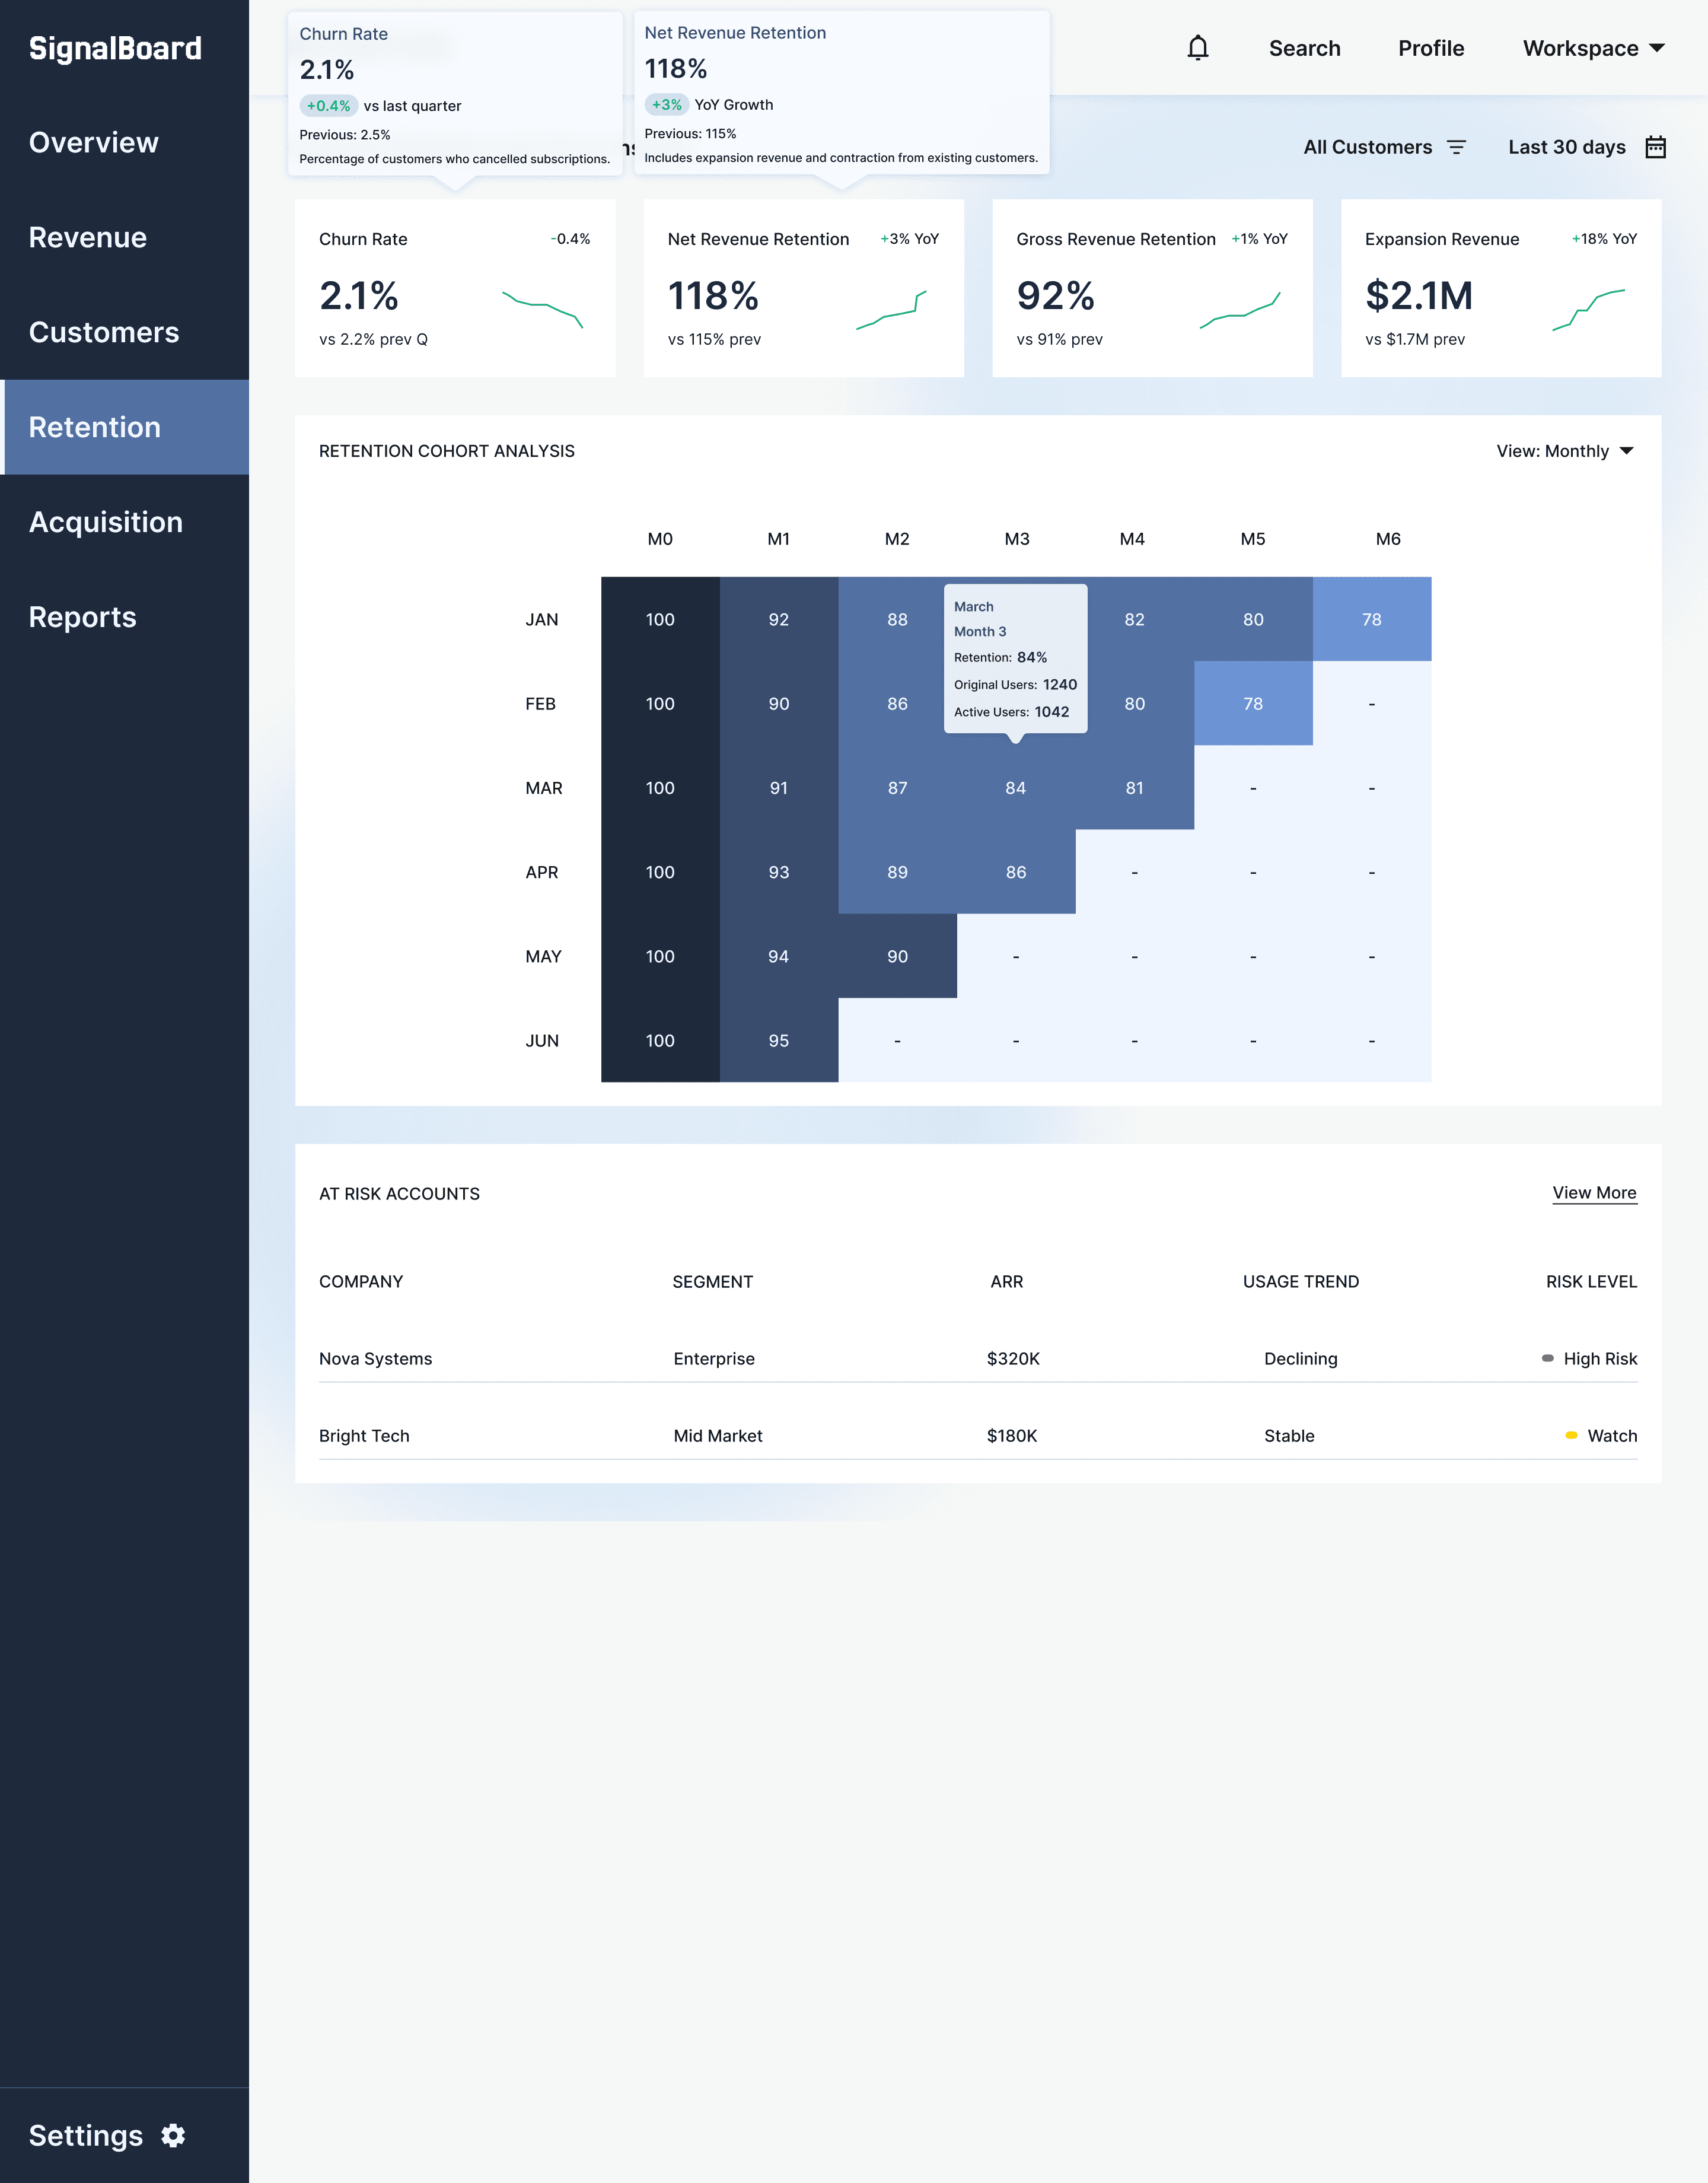
Identify churn risk before it happens
Retention analytics reveal how customer cohorts behave and highlight accounts that may be at risk. • Monitor churn rate trends • Analyze cohort retention over time • Identify high-risk accounts early
Identify churn risk before it happens
Retention analytics reveal how customer cohorts behave and highlight accounts that may be at risk. • Monitor churn rate trends • Analyze cohort retention over time • Identify high-risk accounts early
Identify churn risk before it happens
Retention analytics reveal how customer cohorts behave and highlight accounts that may be at risk. • Monitor churn rate trends • Analyze cohort retention over time • Identify high-risk accounts early
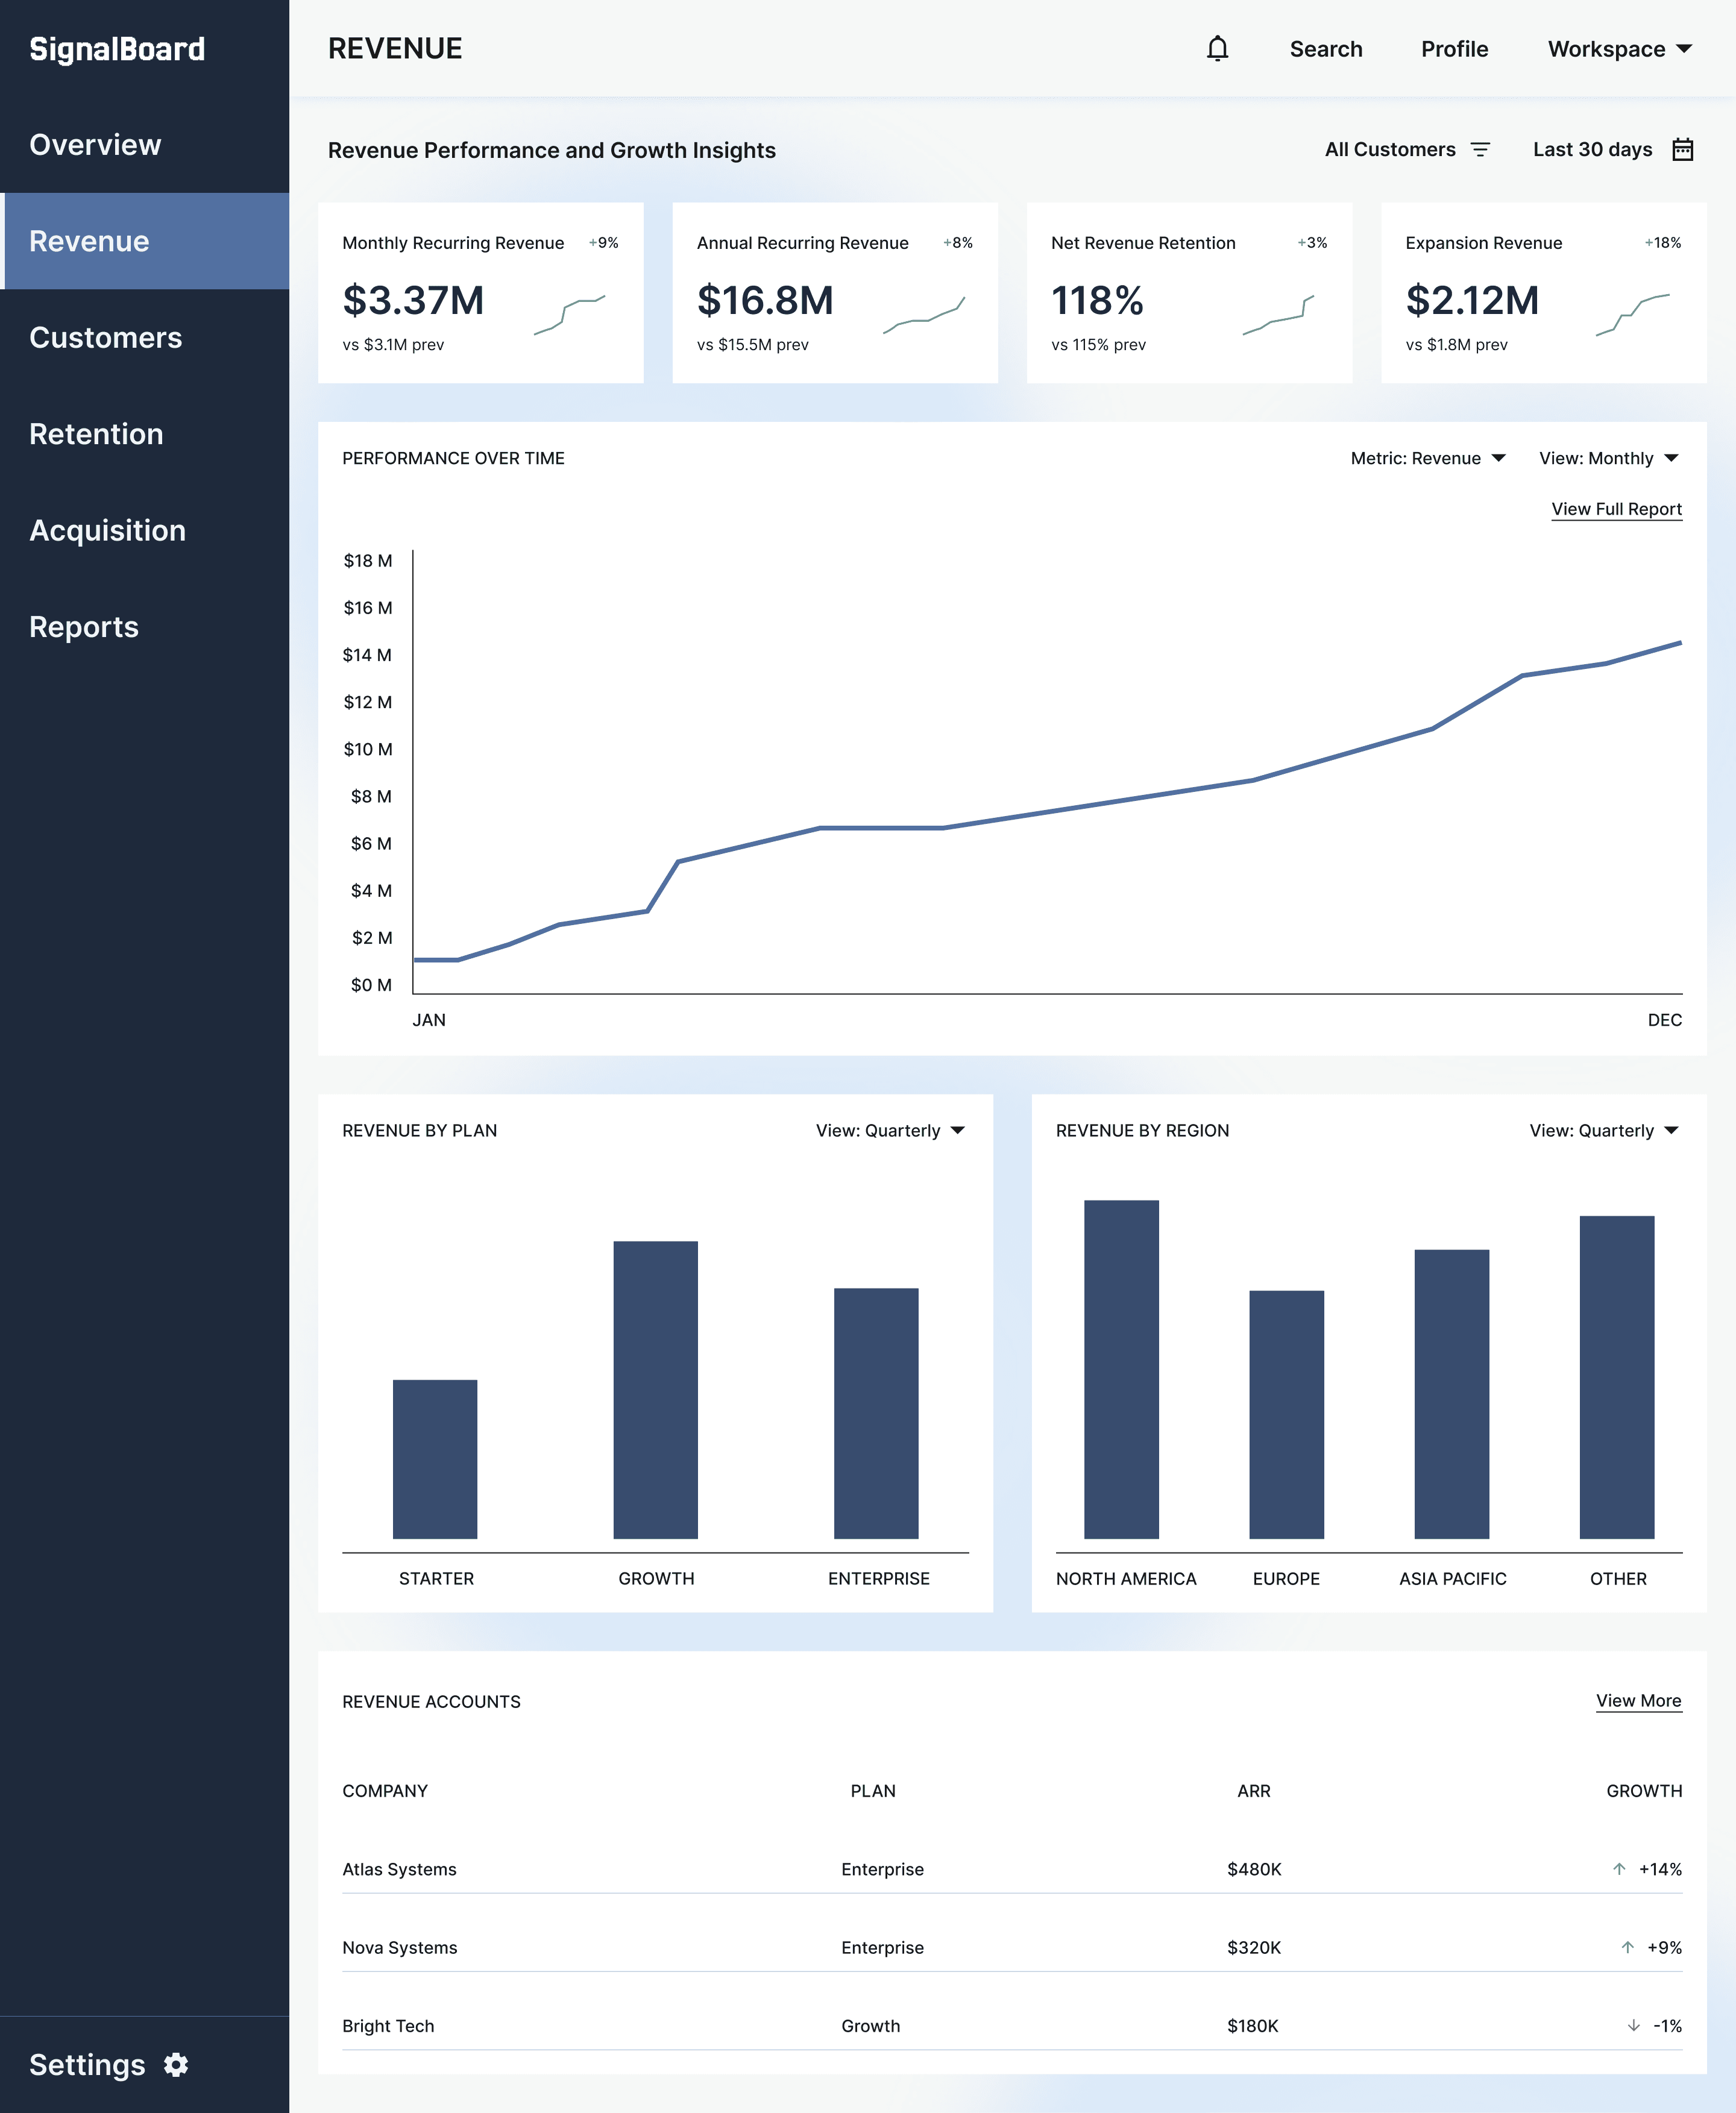
Track revenue performance at a glance
Understand how revenue grows across plans, regions, and customer segments. • Monitor ARR and revenue growth • Compare revenue by plan and region • Track expansion revenue
Track revenue performance at a glance
Understand how revenue grows across plans, regions, and customer segments. • Monitor ARR and revenue growth • Compare revenue by plan and region • Track expansion revenue
Track revenue performance at a glance
Understand how revenue grows across plans, regions, and customer segments. • Monitor ARR and revenue growth • Compare revenue by plan and region • Track expansion revenue
Trusted by SaaS teams worldwide
Trusted by SaaS teams worldwide
Trusted by SaaS teams worldwide
Thousands of SaaS teams rely on SignalBoard to monitor revenue, acquisition, and retention metrics in real time.
Thousands of SaaS teams rely on SignalBoard to monitor revenue, acquisition, and retention metrics in real time.
Thousands of SaaS teams rely on SignalBoard to monitor revenue, acquisition, and retention metrics in real time.
5K+
Active SaaS teams
5K+
Active SaaS teams
2M+
Monthly metrics tracked
2M+
Monthly metrics tracked
99.9%
Platform uptime
99.9%
Platform uptime
5K+
Active SaaS teams
2M+
Monthly metrics tracked
99.9%
Platform uptime
Having revenue, customer growth, and retention insights in one dashboard makes decision making much easier. Leadership can instantly see how the business is performing.

Emma Chen
Design Ops Lead, teamwork.
Our marketing team finally has a clear view of CAC, funnel conversion, and performance. It helps us understand where customers are coming from and where we should invest next.

Priya Mehta
Director of Marketing
The retention dashboards helped us uncover churn patterns we were completely missing before. Now our customer success team can identify risks early and respond much faster.

Lucas Ferreira
VP of Customer Success
As a growth team, we needed a single place to track ARR, churn, and acquisition performance. This gives us clear visibility into the metrics that actually drive our SaaS growth.

Daniel Brooks
Head of Growth
As a growth team, we needed a single place to track ARR, churn, and acquisition performance. This gives us clear visibility into the metrics that actually drive our SaaS growth.
Daniel Brooks
Head of Growth
The retention dashboards helped us uncover churn patterns we were completely missing before. Now our customer success team can identify risks early and respond much faster.
Lucas Ferreira
VP of Customer Success
Our marketing team finally has a clear view of CAC, funnel conversion, and performance. It helps us understand where customers are coming from and where we should invest next.
Priya Mehta
Director of Marketing
As a growth team, we needed a single place to track ARR, churn, and acquisition performance. This gives us clear visibility into the metrics that actually drive our SaaS growth.
Daniel Brooks
Head of Growth
Having revenue, customer growth, and retention insights in one dashboard makes decision making much easier. Leadership can instantly see how the business is performing.
Emma Chen
Design Ops Lead, teamwork.
The retention dashboards helped us uncover churn patterns we were completely missing before. Now our customer success team can identify risks early and respond much faster.
Lucas Ferreira
VP of Customer Success
Our marketing team finally has a clear view of CAC, funnel conversion, and performance. It helps us understand where customers are coming from and where we should invest next.
Priya Mehta
Director of Marketing
As a growth team, we needed a single place to track ARR, churn, and acquisition performance. This gives us clear visibility into the metrics that actually drive our SaaS growth.
Daniel Brooks
Head of Growth
pricing
pricing
pricing
Simple plans for growing SaaS teams
Simple plans for growing SaaS teams
Simple plans for growing SaaS teams
Starter
Free
For early stage startups exploring their growth metrics.
Basic revenue dashboard
Customer growth insights
Acquisition overview
Up to 3 data sources
Exportable reports
Annually
Annually
Monthly
Monthly
Growth
Save 20%
$39/mo
$87/mo
For growing SaaS teams that need deeper analytics.
Everything in Starter
Retention analytics
Cohort analysis
Acquisition insights
API integrations
Custom dashboards
Enterprise
Custom
For scaling SaaS companies with advanced analytics needs.
Everything in Growth
Unlimited data sources
Advanced reporting
Warehouse integrations
Role based access control
Dedicated support
Starter
Free
For early stage startups exploring their growth metrics.
Basic revenue dashboard
Customer growth insights
Acquisition overview
Up to 3 data sources
Exportable reports
Annually
Annually
Monthly
Monthly
Growth
Save 20%
$39/mo
$87/mo
For growing SaaS teams that need deeper analytics.
Everything in Starter
Retention analytics
Cohort analysis
Acquisition insights
API integrations
Custom dashboards
Enterprise
Custom
For scaling SaaS companies with advanced analytics needs.
Everything in Growth
Unlimited data sources
Advanced reporting
Warehouse integrations
Role based access control
Dedicated support
FAQ
FAQ
FAQ
Got a quick question?
Got a quick question?
Got a quick question?
We're here to help you make the right decision. Explore our frequently asked questions and find answers below.
We're here to help you make the right decision. Explore our frequently asked questions and find answers below.
We're here to help you make the right decision. Explore our frequently asked questions and find answers below.
How does SignalBoard ensure data accuracy?
How does SignalBoard ensure data accuracy?
How does SignalBoard ensure data accuracy?
What tools can SignalBoard integrate with?
What tools can SignalBoard integrate with?
What tools can SignalBoard integrate with?
How long does it take to get started?
How long does it take to get started?
How long does it take to get started?
Can dashboards be customized?
Can dashboards be customized?
Can dashboards be customized?
Which SaaS metrics can SignalBoard track?
Which SaaS metrics can SignalBoard track?
Which SaaS metrics can SignalBoard track?
Is my data secure?
Is my data secure?
Is my data secure?
SignalBoard
SignalBoard
SignalBoard
Your SaaS metrics, finally in one place
Your SaaS metrics, finally in one place
Your SaaS metrics, finally in one place
Connect your data sources and start monitoring revenue, acquisition, and retention in minutes.
Connect your data sources and start monitoring revenue, acquisition, and retention in minutes.
Connect your data sources and start monitoring revenue, acquisition, and retention in minutes.